Sale Price:
$3.00
Original Price:
$5.00
A simple, visual way to understand your business finances — no accounting degree required.
This customizable Excel/Google Sheets tool transforms your monthly Profit & Loss report from QuickBooks into a clean, easy-to-read dashboard. With just a copy and paste, you’ll get:
📅 Monthly Overview with key insights
📈 Yearly Overview to track trends
🎨 Fun, visual charts and graphs
✅ Beginner-friendly setup — no formulas or tech headaches
🧠 Designed for clarity, not complexity
✨ Help bar with simplified notes
Whether you're just starting out or want a better way to see your numbers, this tool makes financial tracking simple and stress-free.
All you need is a QuickBooks account and access to Excel/Google Sheets. That’s it!

 Image 1 of 8
 Image 2 of 8
 Image 3 of 8
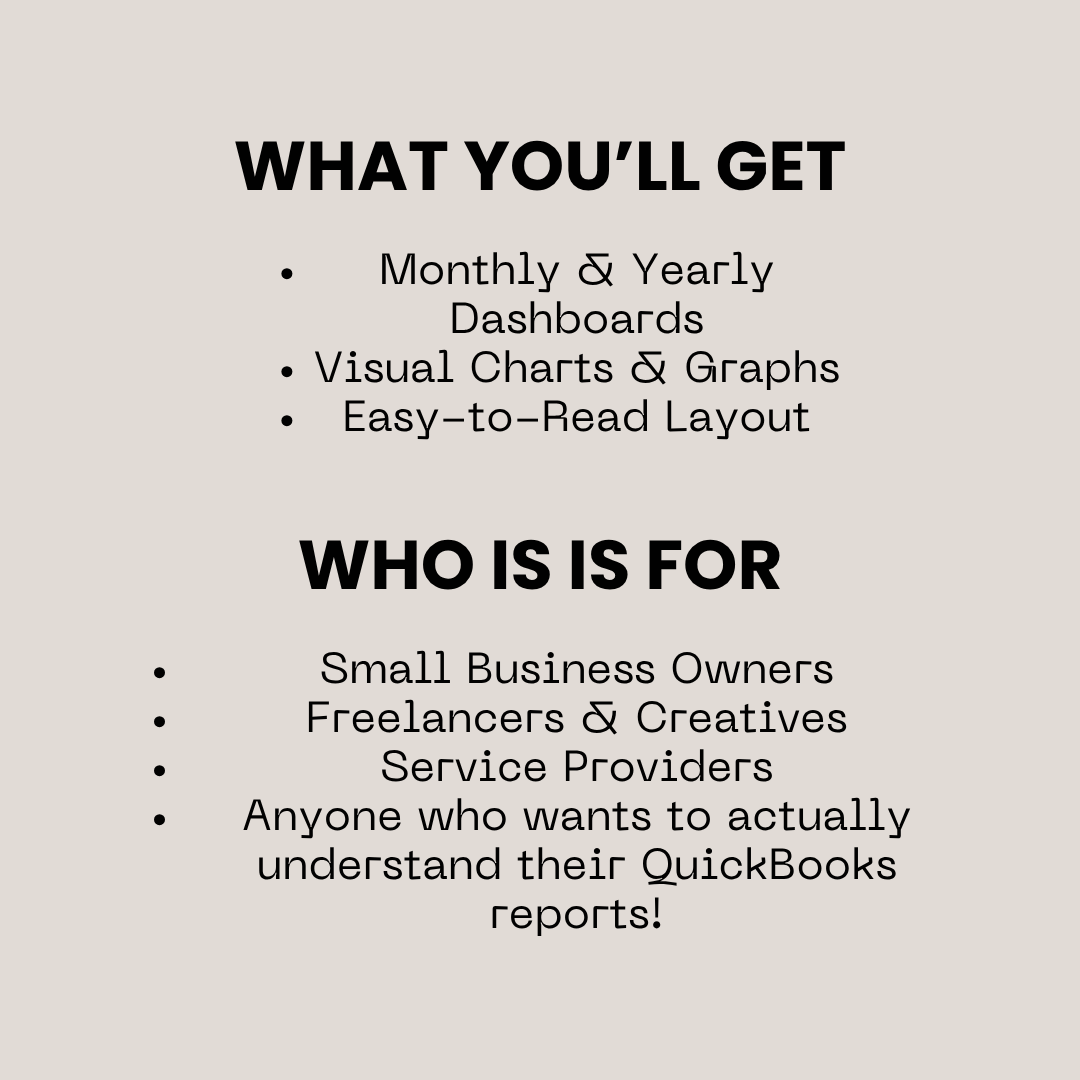 Image 4 of 8
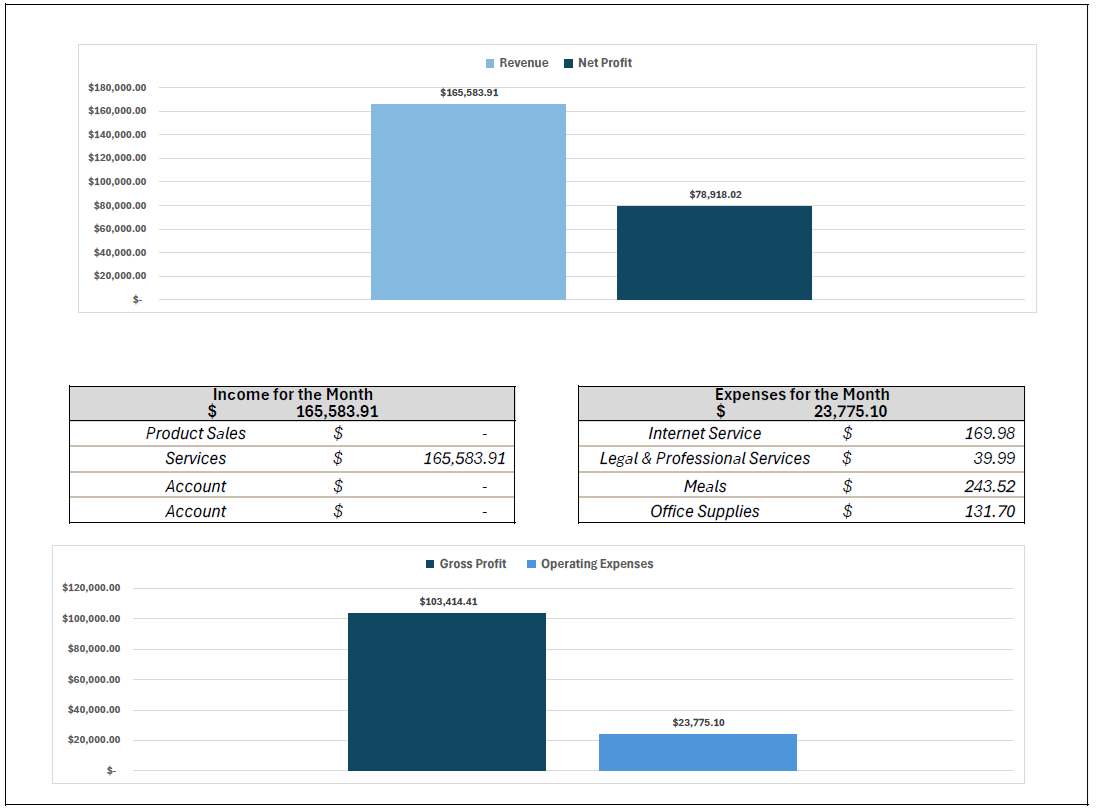 Image 5 of 8
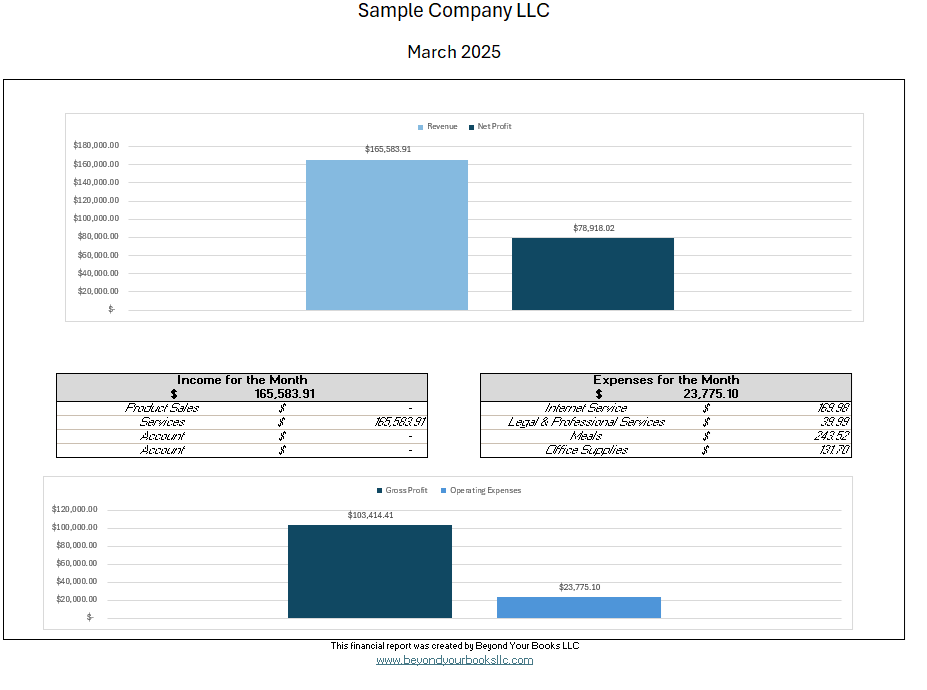 Image 6 of 8
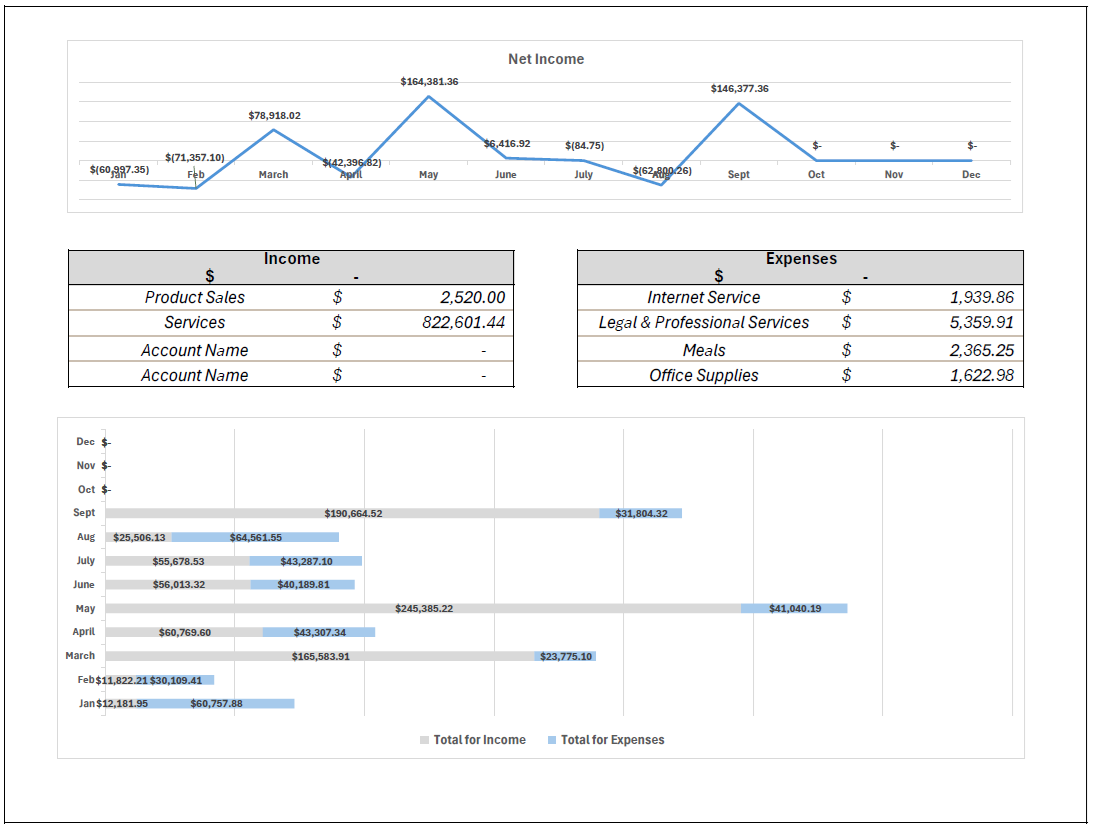 Image 7 of 8
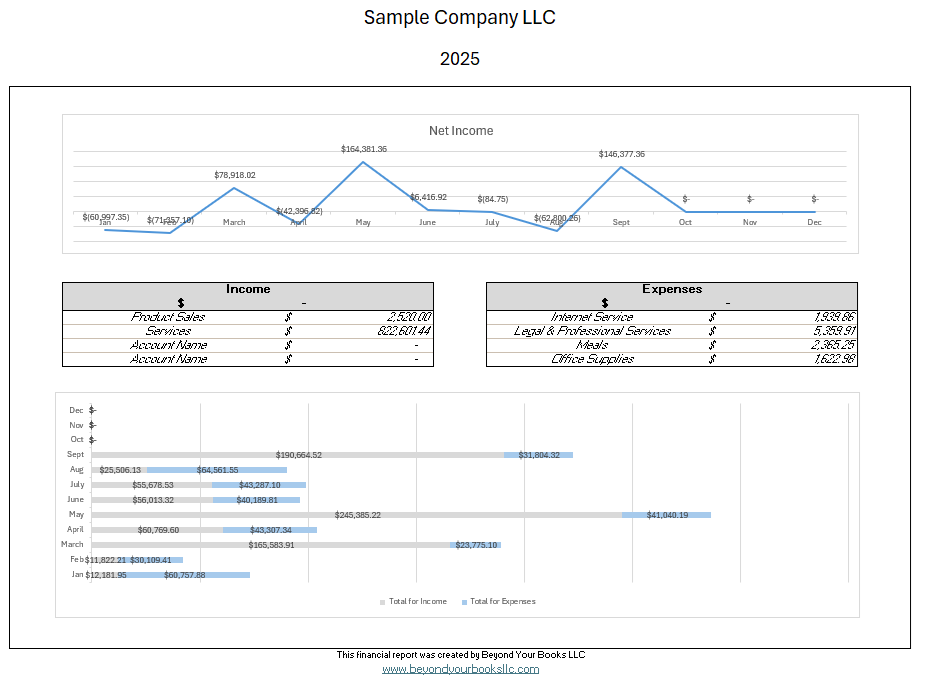 Image 8 of 8